Why stop at wait time displays? It is what you do with the data that counts.
As we head into the busy holiday season, travel is on the rise, and so inevitably are security queues. Over the last several years, airports, recognizing the impact on their passenger experience and their own reputation, have invested in various types of people movement sensors to capture and display wait times to customers. As a result, the guesswork and stress associated with standing in line have thankfully diminished.
However, only using that data to communicate wait times to anxious passengers is a wasted opportunity. It is what airports do with that data, and how they respond to it, that counts.
Scores of airports are now mining deeper insights from their queue, occupancy, and movement data to improve operational planning decisions across pinch points.
If you already measure your wait times, here are some quick tips on how to turn your data into smarter decisions that transform your passenger experience and elevate efficiency.
Look Wider Than the Queue:
Understand that capturing wait time is only one piece of the puzzle. Delve into how queues form and often evolve, where people enter, exit, divest times, and processing productivity are key to improving efficiency. For example, Manchester Airport Group discovered that although it measured wait time, it lacked visibility into wider security flow and divest times, limiting its ability to improve. By deploying Veovo’s sensor agnostic analytics platform across it 3 airports, (Stansted, East Midlands and Manchester) and including new powerful LiDAR sensors, it was able to get granular insight of passenger processing points and as well as understanding curb-to-gate passenger movement by flight.
As a result, it can anticipate problems sooner, improve lane productivity, and make decisions to transform experiences.

Make better capacity plans:
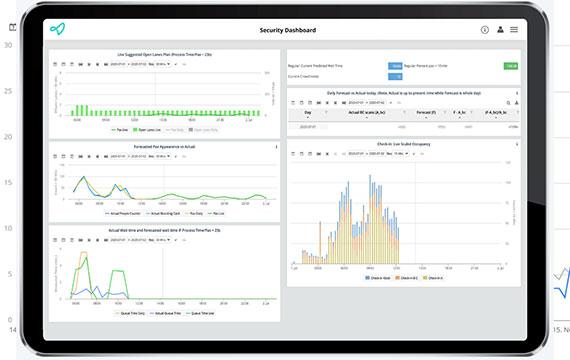
While real-time data is useful, adjusting staffing when a bottleneck is actively building is already too late. Real efficiency boosts occur when airports can accurately forecast passenger arrival, dwell times, and movement paths, creating robust resourcing plans around this. Avinor, the Norwegian airport operator, found that, by using machine learning to forecast people show up profiles, on a highly granular by flight basis, they were able to create very accurate lane opening plans to match show ups. As a result, 91.8% of all passengers waited no more than 10 mins for security screening, even in the peak summer travel season.
Adopt data sharing with your agency partners:
In jurisdictions where security is run by government agencies, such as Transportation Security Administration (TSA), building a solid partnership is instrumental in improving process experiences. A notable success story was at Cincinnati/Northern Kentucky International Airport (CVG), where a strategic collaboration with the TSA resulted in an impressive 33% reduction in queue times. By exchanging and analysing wait time data, CVG helped it TSA partner gain valuable insights into passenger arrival patterns and processing dynamics. This collaborative effort empowered the TSA to align its lane opening plans with the rhythm of passenger traffic. The result wasn’t just a reduction in wait times but a seamless and more efficient screening process.
Automate dispatch:
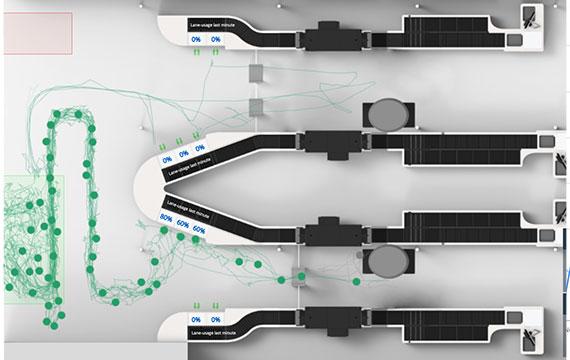
During peak times, security or immigration halls often deploy dispatchers to balance the load by directing people to the next available line. To enhance efficiency, consider automating this process with real-time analysis of queue times and movement data. Keflavik Airport recently implemented Veovo’s Lane Balancer solution—an AI-powered software that intelligently calculates the most suitable line for passengers based on factors like wait times, occupancy, and processing speed. This system prioritizes specific passenger categories if their queue time exceeds the service level target. For example, when the predicted transfer queue time surpasses service levels, more of those passengers are called forward to holding zones, accelerating the overall process.

Allow for Staff Self-Rostering:
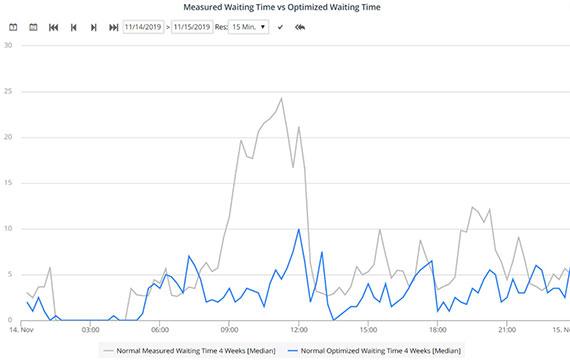
By combining arrival forecasts with staff self-rostering, further efficiency gains can be obtained. This allows teams to evaluate the forecast and adjust their daily roster themselves to cope with projected peaks. For example, they may choose to shift their break by 10 minutes or rotate at a different frequency during busy periods. The grey line below shows the wait time profile of a queue with no predictive recommendations or adjustments to rostering. The blue line shows the improvements experienced when the same staff adjusted their rosters to cope with daily show-up forecasts.
Queue wait-time displays are only one piece of the puzzle. Communicating wait times is an excellent starting point for improved customer experience – however, they are not the end game. Show up forecasts, together with performance evaluations and automation, not only allow for optimized capacity and reduced bottlenecks at pinch points but done well, can improve operational, financial, and capacity planning decisions.

Once you know, you can act in confidence. For busy airports, that makes all the difference.

